 Exclusive sponsor
2026 Market Shift: Which Johns Creek Neighborhoods Are Rising — and Which Are Cooling?
Major local stories and useful updates, once a week.
Listen to a summary of this article:
Johns Creek entered 2026 without a dramatic citywide surge or collapse. Instead, the story is more nuanced. Median prices across the city remain relatively steady — but beneath that stability, sharp differences are emerging between neighborhoods.
Some subdivisions are posting double-digit annual gains. Others are correcting after years of rapid appreciation. And in the luxury segment, price declines do not necessarily mean falling demand.
This deep analysis looks strictly at neighborhoods within the City of Johns Creek and draws from neighborhood-level sales indicators including median sale price, price per square foot, days on market, sale-to-list ratios, and transaction velocity.
The Citywide Snapshot: Stable Surface, Shifting Underneath
At the start of 2026:
- Citywide median sale price: ~ $670,000
- Annual appreciation: modest (~1–2%)
- Average days on market: rising compared to 2025
- Fewer monthly transactions than a year prior
In practical terms, Johns Creek is not in a sharp upswing. But it is also not uniformly softening. Instead, it is fragmenting — by price tier, by housing age, and by neighborhood identity.
The Neighborhood Divide
The most important signal in 2026 is not median price alone. It is the combination of:
- Annual median price change
- Price per square foot change
- Days on market
- Sale-to-list ratio (selling above or below asking)
- Number of monthly transactions (liquidity)
Where both median price and price per square foot are rising, and homes are selling quickly, strength appears structural.
Where both metrics are falling — especially alongside longer Days on Market and below-ask closings — weakness is more likely real.
Neighborhoods Trending Up in 2026
Warsaw (High Volatility, Strong Momentum)

- Median sale price: ~ $1.21M
- Annual change: +37.8%
- Price per sq ft: down year over year
The headline number is dramatic. But declining price-per-square-foot suggests this may reflect a handful of very high-end transactions rather than broad appreciation across all properties.
Verdict: Rising, but volatile.
The Country Club of the South (Luxury Strength)

- Median sale price: ~ $2.38M
- Annual change: +20.8%
- Price per sq ft: rising
- Days on Market: moderate
This gated golf community continues to show structural strength in the $2M+ tier. Price growth is supported by per-square-foot gains, suggesting real demand rather than statistical distortion.
Verdict: Strong luxury segment resilience.
Ocee (Broad-Based Appreciation)

- Median sale price: ~ $720K
- Annual change: +20.3%
- Price per sq ft: +12.4%
Both price measures are rising. This signals genuine demand strength, especially in the sub-$800K segment.
Verdict: One of the clearest upward neighborhoods in 2026.
Deer Lake
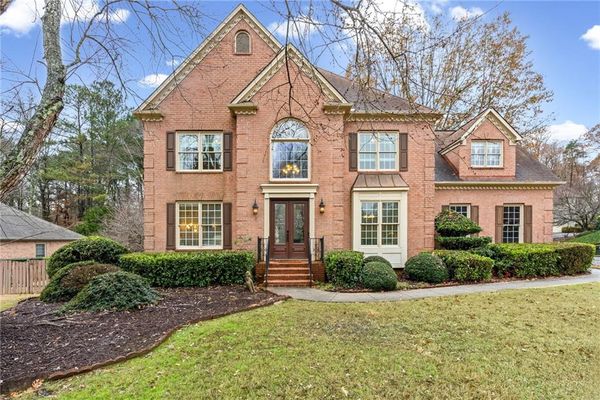
- Median sale price: ~ $1.01M
- Annual change: +14.9%
- Days on Market index: very low
Homes are moving quickly, but monthly sales volume is limited. Strength is present — but data is thinner.
Verdict: Positive momentum, watch for confirmation through more transactions.
Wellington
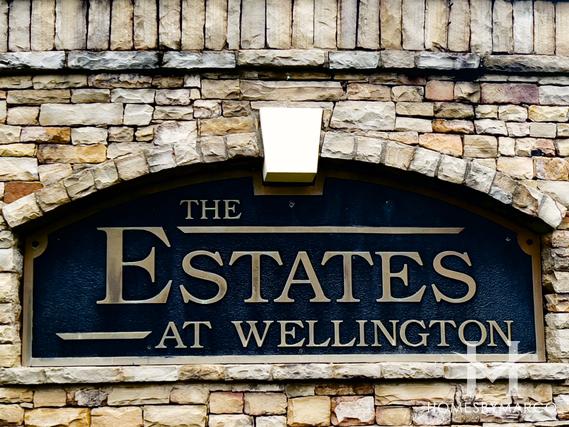
- Median sale price: ~ $628K
- Annual change: +9.2%
- Price per sq ft: rising
Solid growth without excessive volatility. In a city averaging around $670K, Wellington remains relatively accessible.
Verdict: Healthy mid-market performer.
Neighborhoods Showing Signs of Softening
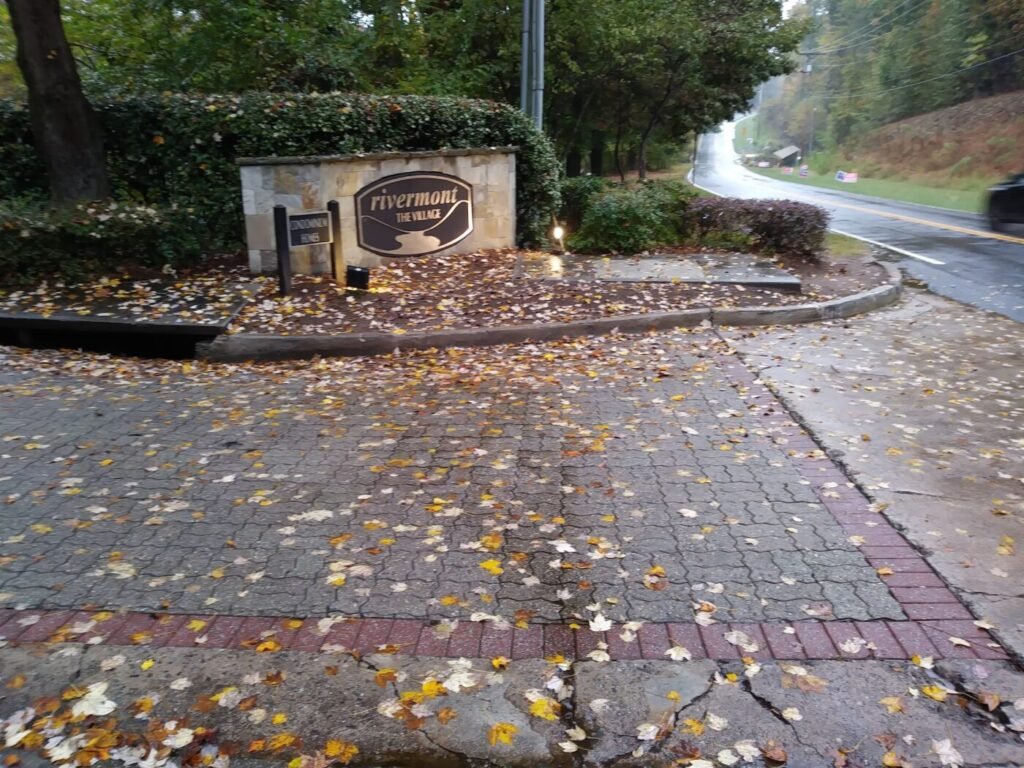
Rivermont (Clear Price Pressure)

- Median sale price: ~ $408K
- Annual change: −14%
- Price per sq ft: −24.5%
- Sales below asking
Both price metrics are down sharply. This suggests more than statistical noise.
Verdict: Genuine softness in this sub-$500K segment.
Newtown (Correction in Progress)

- Median sale price: −12.4%
- Price per sq ft: −26.7%
- Days on Market index rising significantly
Newtown appears to be adjusting after prior strength. Longer marketing times reinforce that sellers must price carefully.
Verdict: Clear cooling trend.
St. Ives Country Club

- Median price down ~12.6%
- Days on Market index improved year over year
This looks more like price normalization in the luxury tier than collapsing demand.
Verdict: Luxury recalibration, not distress.
St. Marlo Country Club

- Median price: −10.2%
- Sale-to-list ratio: ~99%
- Market described as very competitive
Prices are adjusting, but buyers are still active.
Verdict: Price correction with demand intact.
John’s Creek Walk

Low transaction count and longer Days on Market make this area statistically sensitive. One sale can move the annual metric significantly.
Verdict: Too thin to define a clear trend.
The Structural Variable: Medley and the Town Center Shift
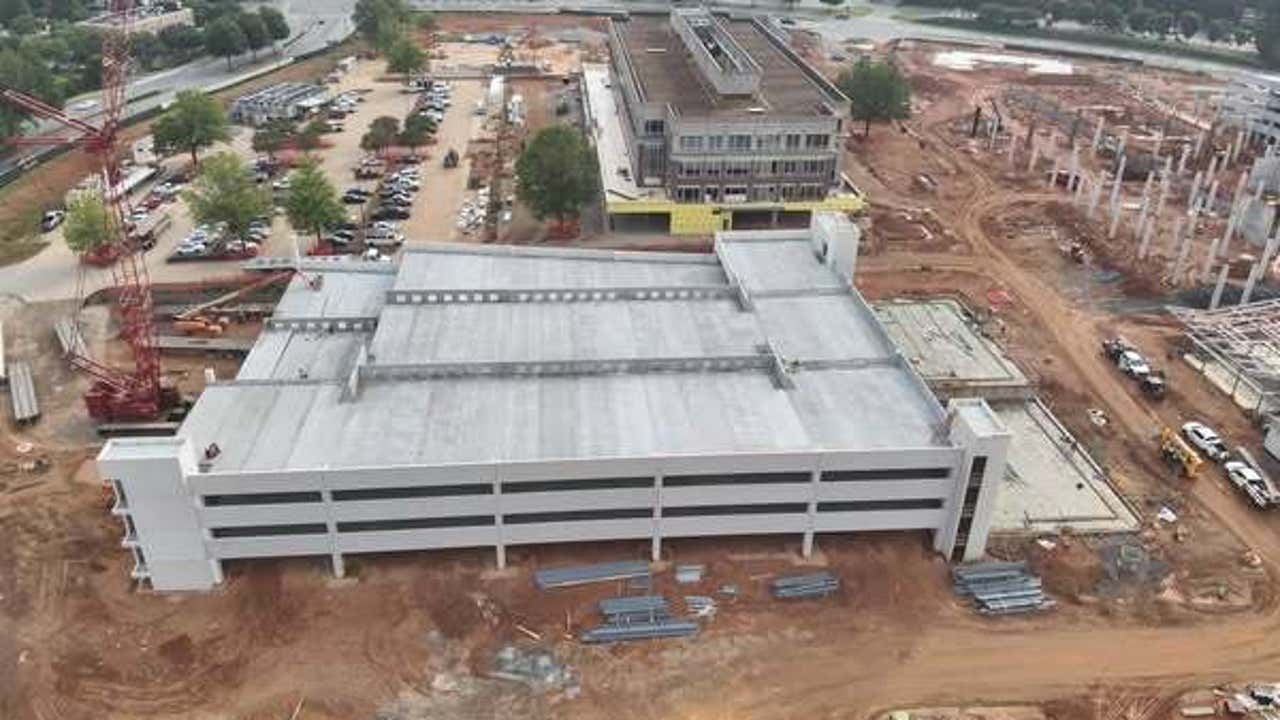

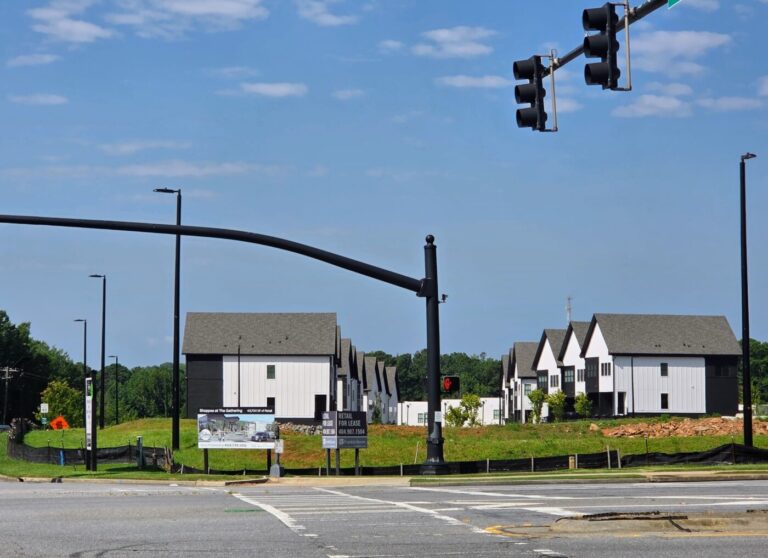
The most consequential development is the $560M Medley mixed-use project at Johns Creek Parkway and McGinnis Ferry Road.
Key components:
- 883 residential units (apartments + townhomes)
- 164,000 sq ft retail and restaurants
- 110,000 sq ft office
- 150-room boutique hotel
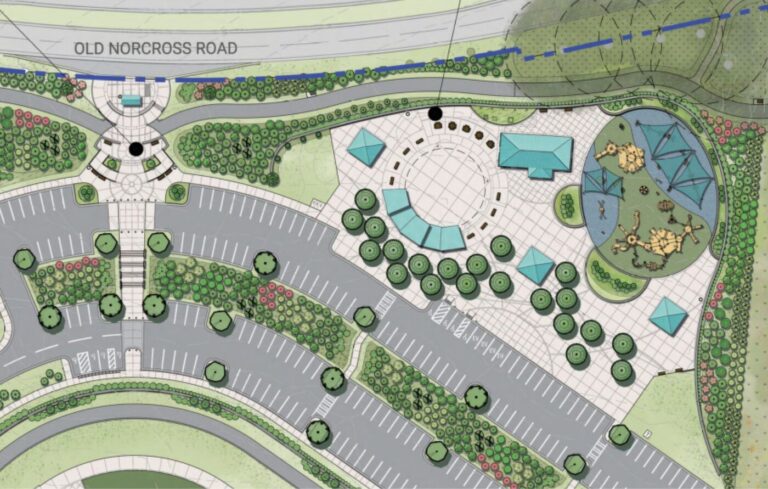
- Public plaza designed for events
Expected completion timeline: 2026–2028 phases.
The likely impact:
- Increased competition for older, non-renovated homes
- Stronger demand for walkability and proximity to activity
- Internal demand shift within Johns Creek rather than broad citywide price lift
This is a structural change — not just a market cycle.
Read also: Medley and Town Center Development
Price Tier Observations
Under $800K
Strong pockets (Brookwood, Ocee) alongside notable weakness (Rivermont, Newtown).
$800K–$1.2M
Mostly stable, but longer Days on Market in certain subdivisions signals buyer selectivity.
$1.2M–$2M
Luxury correction phase in some golf communities.
$2M+
Resilient at the very top tier.
What This Means for Buyers and Sellers
For buyers:
Look beyond median price headlines. True strength appears where both median and price per square foot are rising.
For sellers:
Neighborhood-specific pricing strategy is critical. In cooling subdivisions, aspirational pricing may extend Days on Market significantly.
For investors:
Pay attention to price-per-square-foot declines — they often reveal deeper softness than median price alone.
For relocating families:
As Medley progresses, proximity to a town center environment may begin to compete with purely school-zone-driven decisions.
Johns Creek in 2026 is not one market. It is multiple micro-markets moving at different speeds.
Understanding that fragmentation is the key advantage in today’s environment.
Key Takeaways
- The Johns Creek real estate market in 2026 shows steady median prices, but significant neighborhood divergence in trends.
- Some areas like Warsaw and Ocee see strong appreciation, while Rivermont and Newtown reveal signs of softening.
- The Medley mixed-use project will impact local demand, promoting walkability and competition for older homes.
- Price tiers vary, with strong segments under $800K and resilience in the luxury market above $2M.
- Buyers and sellers must adopt neighborhood-specific strategies to navigate this fragmented market effectively.
Relocating to Johns Creek?
Our in-depth relocation briefing delivers detailed, procedural guidance on utilities setup, vehicle registration, homestead exemption, school enrollment, permitting, and HOA considerations specific to Johns Creek.
Receive the Full Johns Creek Relocation Briefing Series
Read Also:
Community Voice
A snapshot of reader views, not a scientific survey.
Explore Community Voice →About the Author


In North Atlanta
North Atlanta Home Buyers Have Something They Haven’t Seen in Years: Leverage

Johns Creek Approves 48-Home Subdivision on Church Campus

Moving to Johns Creek: What Pet Owners Should Know

Johns Creek Native to Lead Medley’s Concierge Team Ahead of October Opening

What North Atlanta Should Know Today, Tuesday, Sept. 1, 2026
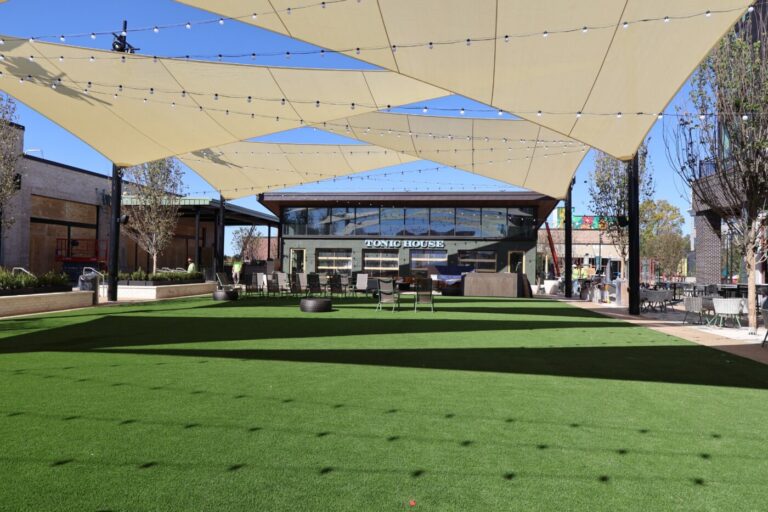
We walked through Medley before opening day. Here’s a look inside.
IN NORTH ATLANTA